HSPICE & CSCOPE
Quick Tutorial
Here is a brief review of the steps required for running HSPICE and CSCOPE on vlsicad.
1.
Start
Xming
2.
Use
SSH to connect to your account at username@vlsicad.ecs.umass.edu
3.
Change
dir to vlsix
4.
Generate
your SPICE file using text editor
5.
Run
HSPICE vlsicad:>
hspice filename.spice
6.
Run
CScope using vlsicad:> cscope
Here is an example of a simple RC circuit file where a step input is applied to R1:

HSPICE input file for the circuit is given below where .MEASURE statement use used to measure the propagation delay from the step input at node ‘a’ to a 50% rise in voltage at node ‘b’.
* Simple RC circuit
.OP
.OPTION POST
R1 1 2 1K *
Resistance
C1 2 0 1uF *
Capacitnace
V1 1 0 PWL (0s 0V 2ms 0V 2.001ms 1V 10ms 1V) * piece wise linear
waveform
.TRAN 1us 10ms *
Transient analysis till 10ms
* Measure delay from v(1) to v(2)
.MEASURE TRAN td TRIG=v(1) VAL=0.5 RISE=1 TARG=v(2)
VAL=0.5 RISE = 1
.END
Perform the following steps:
1.
The
file is stores as rc_circuit.spice
2. Run hspice vlsicad:> hspice rc_circuit.spice > rc_circuit.log. It will generate rc_circuit.tr0 file and an rc_circuit.mt0 file. rc_circuit.tr0 contains the waveform information to be viewed in CScope and rc_circuit.mt0 contains the time value measured by .MEASURE statement. Check the rc_circuit.log file to see if the simulation concluded or was aborted.
3. Start CScope by using vlsicad:> cscope command. In CScope open the file rc_circuit.tr0 to view the waveforms and make manual measurement
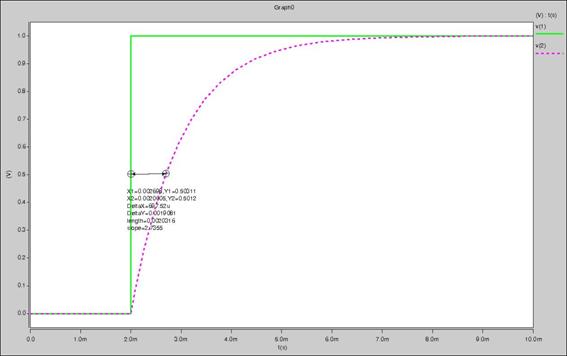
1. The propagation time is obtained as 692us from the rc_circuit.mt0 file and 697.5us from manual measurement. The more accurate value is the one obtained from HSPICE.