Cache Organization with Unified/Separate Instruction and Data Caches
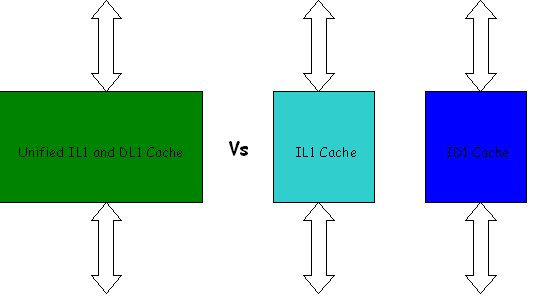
In this lab, you will investigate the performance of cache with unified/separate instruction and data caches (see Figure 1) while executing test-math program.
(Fig 1)
1) Use sim-cache to simulate the performance of the cache under the following conditions:
least-recently-used (LRU) replacement policy
16-byte cache lines (block size)
Sets/associativity combinations: 128/1, 128/2, 128/4, 2048/1, 2048/2, 2048/4
Only L1 caches will be used in this problem; L2 caches will be assumed not present
To do this, specify a split cache configuration that has instruction and data caches that are half the size of the unified cache, for each of the prescribed sets/associativity combinations (i.e. a 128-set unified configuration would be compared to a 64-set instruction/data caches in a split configuration).
To compare the performance of the split cache to the unified cache, one must compute the overall miss ratio of the split cache. To do this, one must take note of the total number of accesses to each of the instruction and data caches, and the number of misses. The simulator will give you the miss rates for the instruction and data caches, which should be (instruction misses)/(instruction accesses) and (data misses)/(data accesses) respectively. The effective combined cache miss ratio can be computed as: (instruction misses + data misses)/ (instruction accesses + data accesses). The number of accesses to each cache should be the same for each configuration; you need only record this once. The number of misses must be recorded for each configuration. Fill Table 1 below.
| Sets/Assoc | I-Cache Miss No (N/2 sets)+ | D-Cache Miss No (N/2 sets) | Effective Combined Cache Miss Rate* | Unified Cache Miss Rate |
| 128/1 | ||||
| 128/2 | ||||
| 128/4 | ||||
| 2048/1 | ||||
| 2048/2 | ||||
| 2048/4 |
+ The number N is the number of sets in the unified cache, the split cache consists of two caches of N/2 sets.
* effective combined cache miss rate = (data misses + inst misses)/((data accesses + inst accesses)
Use MATLAB (or EXCEL) to create two plots: one for 64 set split vs. 128 set unified cache performance, and another for 1024 set split vs. 2048 set unified cache performance. On each plot, use the sim-cache data in the above table to graph miss ratio vs. associativity. On each plot, there should be two curves:
1) effective combined cache
miss rate, and
2) unified cache miss rate.
Bonus part
Measure CPI for the split and unified
caches for the configurations in table 1 above. Note that you will have to use
sim-outorder with configuration file default.cfg
modified according to the configurations in table 1. Fill Table 2 below.
|
Sets/Assoc |
CPI Unified Cache | CPI Split Cache |
| 128/1 | ||
| 128/2 | ||
| 128/4 | ||
| 2048/1 | ||
| 2048/2 | ||
| 2048/4 |
Now plot using MATLAB or EXCEL, CPI Vs Associativity for 128 sets and 2048 sets for the unified and split cache cases.