A naive cost-performance design assumes 100% utilization of I/O resources. This assumption leads to a servere increase in response time as we approach 100% utilization. This can be illustrated by a simple calculation for one disk, and we will also ignore SCSI strings and controller.
Assumptions:
Characteristics of M/M/1 queue:
Equations used to evaluate response time:
Server utilization
= Arrival rate * TimeServer
Time queue
= Timeserver * Server utilization/(1 - Server utilization)
Time system(Response time)
= Timeserver + Timequeue
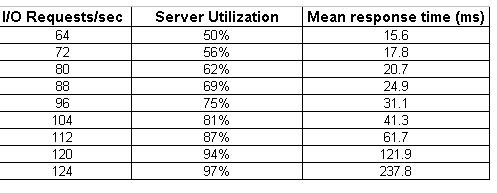
Example: For 64 I/O requests per second
Server utilization = 64 * 0.0078 = 0.50 ie 50%
Time queue = 7.8ms * 0.50/(1-0.50) = 7.8ms
Time system(response time) = 7.8ms + 7.8ms =
15.6ms
The table below shows the server utilization and response time for differnet request rates.
The Graph below plots the response time versus request rate
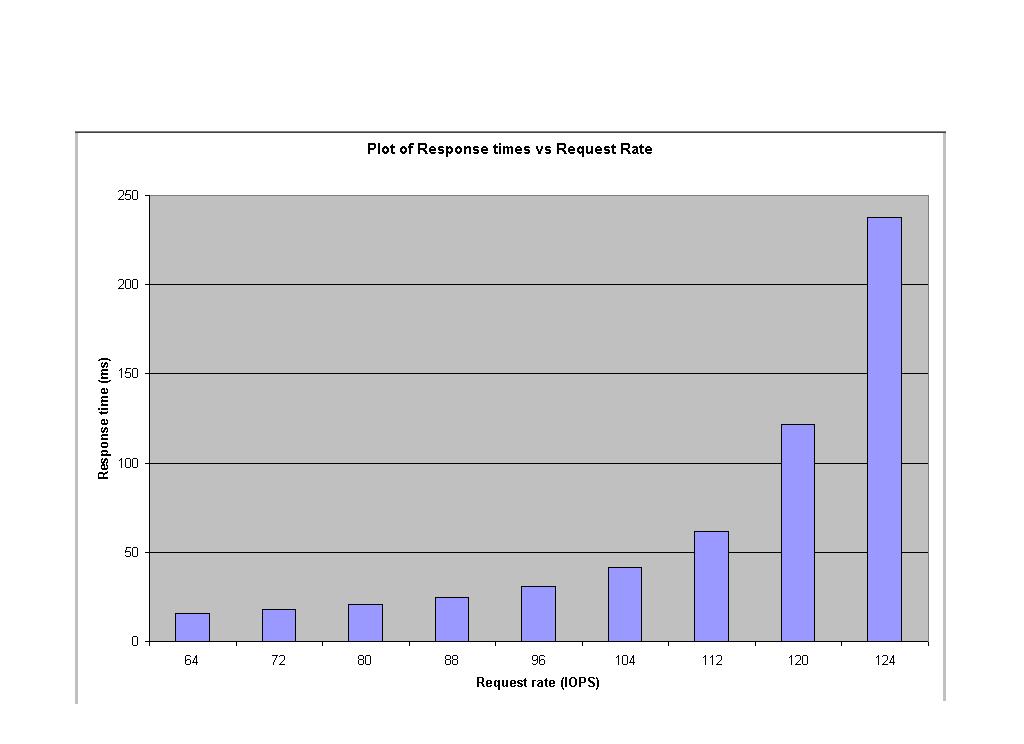
From the graph, we see that 100% utilization of disks is quite unrealistic. The response time tremendously increases as we try to use 100% of the server.
The organization of a realistic cost-performance design should be performance-tuned. It should be aimed at limiting the utilization of I/O resources in order to keep reponse time and contention low. Below is an example of rules of thumb that could guide I/O designers to meet the above goals:-
(The reason the SCSI string bandwidth is set so low is that there is about a 20% SCSI command overhead on data transfers, further reducing available bandwidth)