CHAPTER XXII
MISCELLANEOUS INSTRUMENTAL METHODS
A. METHODS USING INFRARED ANALYSIS
1. Total Organic Carbon Analysis
a. Basic Principles
Total organic carbon analysis is a determination of organic carbon in a sample regardless of its oxidation state or biodegradability. Other measures of total organic matter (e.g., COD, BOD) may respond differently to solutions of equal carbon concentration depending on the oxygen content or the bidegradation kinetics. For the measurement of total organic carbon, the sample is exposed to an oxidizing environment often at very high temperatures. With complete oxidation all carbon is converted to carbon dioxide and swept into a detector by the carrier gas. The oxidation process is based on the following stoichiometry:
![]() (22.1)
(22.1)
b. Instrument Design
The various instruments available differ in the nature of the oxidizing environment, or in the type of detector. For the oxidation process there are two principle types; high-temperature pyrolysis systems, and low-temperature photochemical systems. The pyrolysis systems are exemplified by the Beckman systems (915A, 915B, and Tocamaster). Samples are rapidly oxidized by injection into a 950oC furnace in the presence of oxygen. The furnace is packed with cobalt oxide impregnated inert support which serves as a catalyst to promote rapid oxidation. No organic compounds have been reported to be incompletely oxidized by the pyrolytic system (Cooper & Young, 1984), and this is the only system which is thought to give complete oxidation of samples high in particulate matter (e.g., sludges).
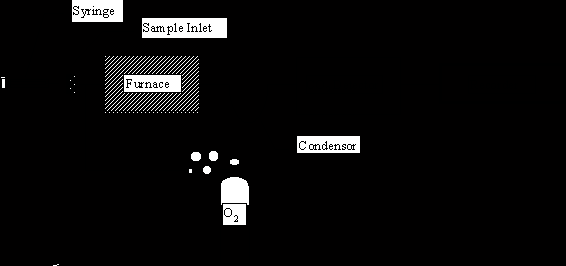
Figure 22.1 Schematic of a high temperature Pyrolysis TOC unit
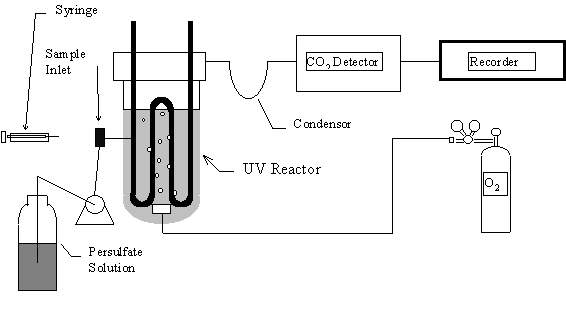
Figure 22.2 Schematic of a Typical UV/Persulfate TOC Unit
Three low-temperature photochemical oxidative systems are commercially available, ultraviolet irradiation, heated persulfate, and persulfate/UV. The simple ultraviolet method gives incomplete oxidation with most environmental samples, however, it is useful in the on-line analysis of high purity water. Heated persulfate (~100oC) techniques have proved useful for the oxidation of particulate organic matter, however, extensive sample manipulation and long reaction times make it less attractive for routine analysis. By far the most common photooxidative technique is the persulfate/UV method (Dohrmann DC-80 analyzer). It relies on the synergistic oxidative power of persulfate and ultraviolet light. This is a result of the formation of highly-reactive free radicals as shown in equations 22.2-22.4
![]() (22.2)
(22.2)
![]() (22.3)
(22.3)
![]() (22.4)
(22.4)
The hydroxy and sulfate radicals can react with organic matter to give oxidized products. Ultimately, carbon dioxide is formed. Some oxidation also occurs by direct absorption of UV light by the organic material. These free radical oxidation pathways are relatively quick, although certain organic compounds such as cyanuric acid and its amine derivatives are resistant, and therefore not measured (Crane, 1988). In addition, environmental samples high in dissolved humic acids and particulate organic matter may undergo incomplete or sluggish oxidation. Slow oxidation can especially be a problem with samples high in chloride. Some manufacturers recommend addition of mercuric salts to minimize the adverse effects of chloride.
Detection systems used with TOC analysis include non-dispersive infrared analysis, electrolytic conductivity detection, coulometric titration, and reduction to methane followed by flame ionization detection. By far the most common detector is the non-dispersive IR analyzer (NDIR; used in both Beckman and Dohrmann instruments). It measures the infrared light absorbed by carbon dioxide as it passes through a flow-through IR absorption cell (Figure 22.3). Interferences from other IR-absorbing gases are minimized by use of a highly wavelength-specific detector (Emery et al., 1971). The sensing element of this detector is carbon dioxide itself. Carbon dioxide will absorb IR light of a few characteristic wavelengths, whether it is flowing through the absorbance cell, or permanently trapped within the detector chamber. Therefore, light that passes completely through an IR cell containing CO2 and into the detector is depleted in these wavelengths. The CO2 in the detector absorbs a portion of the remaining light (of the characteristic wavelengths), and converts the light energy into thermal energy. This thermal energy is measured as pressure by a deflecting diaphragm. The greater the inward deflection, the lower is the light intersity reaching the detector, and the greater is the concentration of CO2 in the absorbance cell. Generally, sample and reference cells are located side-by-side. The reference absorbance cell is either sealed with an inert gas, or is fed carrier gas in a flow-through mode. In this case, side-by-side detectors are also used, with the diaphragm measuring differential pressure between the detector cells.
While the use of CO2 in the detector minimizes interferences, water vapor may pose some problems. For this reason, it is important to remove as much water as possible prior to introducing the gas stream into the IR analyzer. This is commonly accomplished with air-cooled or water-cooled condensers.
Electrolytic conductivity detectors are simple and quite sensitive, however, they are prone to severe interference from other ionic species. This method of detection is sometimes used with UV oxidation in the on-line analysis of high purity water. Reduction of CO2 to CH4, followed by flame ionization detection is also an extremely sensitive detection technique (Dohrmann DC-54). Unfortunately, it is more complicated and time-consuming than the NDIR method. For this reason, it is not widely used in the analysis of environmental samples.
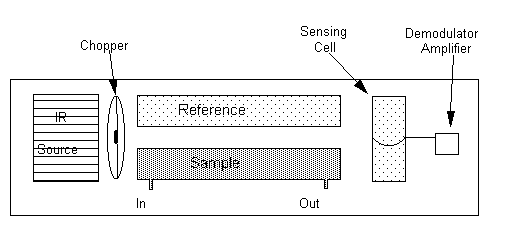
Figure 22.3
Non-dispersive Infrared Analyzer
c. Nomenclature
Figure 22.4 shows the commonly-accepted carbon fractionation scheme with associated nomenclature. Carbon may be present in a sample as inorganic carbon (+IV oxidation state), or as organic carbon (-IV to +III oxidation states). Inorganic carbon is most commonly present as free carbonate species (i.e., carbonate, bicarbonate and carbon dioxide). These are both dissolved and purgeable. However, with some samples, expecially semi-solids, it may be incorporated into carbonate minerals, which are particulate and non-purgeable. Total organic carbon is also composed of purgeable and non-purgeable fractions. While the purgeable organic carbon is always dissolved, the non-purgeable may be either dissolved or particulate. The POC comprises certain hydrocarbons, ketones, aldehydes, and halogenated hydrocarbons (i.e., VOCs). In most water samples, the purgeable organic carbon fraction is insignificant when compared to the NPOC. The non-purgeable fraction may contain dissolved and particluate material.
Total Carbon (TC)
| .
| |
Inorganic Carbon (IC) Total Organic Carbon (TOC)
| | .
| | | |
Purgeable Non-Purgeable Purgeable Organic Non-purgeable Organic
(Dissolved) (Particulate) Carbon (POC) Carbon (NPOC)
| .
| |
Particulate Dissolved
(PtOC) (DOC)
Figure 22.4
Carbon Fractionation
d. Organic vs Inorganic
Organic carbon may be distinguished from inorganic carbon (i.e., carbonate, bicarbonate and carbon dioxide) by taking advantage of the volatility of the latter at low pH. All methods based on this technique presume that the non-purgeable inorganic carbon is insignificant, which is a good assumption for drinking waters. One of three procedures may be used. The "direct method" requires that each sample be pretreated with phosphoric or sulfuric acid and bubbled with nitrogen gas for about 5 minutes. The low pH environment shifts the carbonate equilibrium toward aqueous CO2 (equation 22.5), and the bubbling strips the carbon dioxide from solution. This sample is then subjected to TOC analysis. This is the easiest, and often the most precise method. However, acidification may lead to precipitation of humic materials. The presence of newly-formed insoluble carbon can cause low and erratic results. In addition, samples with a significant concentration of purgeable organic carbon will be subject to negative bias, due to stripping of the POC during sample pretreatment. For this reason, measurements made by the "direct method" are often referred to as NPOC, rather than TOC.
CO3-2 + 2H3PO4 -----------> CO2 + 2H2PO4- + H2O (22.5)
The "method by difference" calls for separate determinations of total carbon (TC of an unpurged sample) and inorganic carbon. The analysis of inorganic carbon is achieved by use of a low temperature (~150oC) non-oxidative furnace packed with inert chips soaked in 85% phosphoric acid. As with the "direct method", the low pH environment shifts the carbonate equilibrium toward aqueous CO2. Then, the high temperature and high surface area promote volatilization of the carbon dioxide. TOC is calculated as the difference between total carbon and total inorganic carbon. Significant errors can result with this method when the ratio of IC ot TOC is high.
The third technique is sometimes referred to as the method "by sum". Here, purgeable organic carbon and non-purgeable organic carbon are measured separately, and added to get the TOC. The specific measurement of POC requires that it be separated from IC by one of three ways. First a sample may be acidified/purged as in the "direct method", and the purge gas directed to a CO2 detector. This first step would give the IC concentration. Then, an identical sample would be acidified/purged and the gas directed through an oxidation chamber and to a detector. The POC would be calculated as the difference between the two measurements. The second and third methods use lithium hydroxide or a molecular sieve to selectively trap CO2 given off during initial acidifiction/purge. The scrubbed gas, containing only POC, is then directed to oxidation chamber and detector for quantification. When a molecular sieve is used, a separate analysis cycle may be incorporated to measure IC. This is done by thermally desorbing the carbon dioxide and directing it to a detector.
Sources of error in the measurement of TOC include:
1. loss of volatile organic compounds during purging procedure. Compounds such as benzene, toluene, and cyclohexane may be lost.
2. Inorganic species which produce vapors that absorb infrared light and cause a positive interference.
3. Heavy metals may poison the catalysts
4. Variable injection technique (e.g., speed
5. Errors in injection volume (e.g., air bubbles in syringe)
6. Particulate matter and refractory organics that may be incompletely oxidized
7. High chloride concentrations that may retard oxidation
2. Portable Gas Analyzers
A wide range of organic vapors and inorganic gases can be measured by direct infrared absorption. Numerous hand-held meters are commercially available (e.g., Foxboro's "Miran" series of analyzers). These may have pathlengths of up to 20 meters, and may detect concentrations down to 1 ppm.
1. UV Absorbance and Color
Very little structural information may be obtained from the ultraviolet-visible absorption spectrum of humic substances. Figure 15 shows a typical scan of an aquatic fulvic acid and three other NOM fractions. Note the total lack of features. One sees only a monotonic decrease in absorbance with increasing wavelength. Nevertheless, the absolute value of the absorbance has been found to correlate with certain water quality characteristics, such as DOC and THMFP.
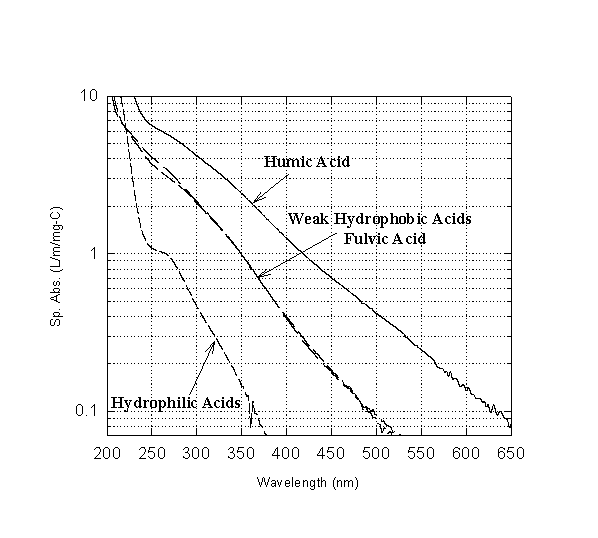
Figure 15
UV-Visible Absorbance Scan of Aquatic Humic Substances (from Reckhow et al., 1992)
It is now reasonably well established that the absorbance of light in the UV-Visible range by aquatic humic substances conforms to Beer's law (Black & Christman, 1963a,b, Packham, 1964). That is, the concentration of humic materials in a natural water which has been diluted with distilled water is linearly proportional to its absorbance. Therefore, one can calculate a specific absorbance which corresponds to the absorbance per mg/l of DOC. Some specific absorbances for extracted humic materials are listed in Table 8. As a result of the conformance to Beer's law the DOC of a raw water can be estimated by measuring its absorbance at a fixed wavelength provided that the relative concentration of all the constituent organics remains fixed. Although this is never strictly true, changes in the nature of the raw water may be small enough to be unimportant. Table 14 summarizes some attempts to correlate UV absorbance (254 nm) to DOC for raw waters. Note that the reciprocal of the slopes in Table 9 correspond to the specific absorbances in Table 8, and that the average slope (~25) gives a specific absorbance of 0.004 which is similar to those reported for riverine fulvic acids.
Note that groundwater humics and humics from eutrophic lakes are less colored than riverine humics. Humics from bogs and swamps are most colored.
Since color increases with increasing pH, it is important to make all color measurements at the same pH. By convention, a pH 7 phosphate buffer is generally used.
Table 8
Specific Absorbance of Aquatic Humic Substances
|
Sample |
Specific Color (400nm) |
Specific UV abs (254nm) |
Ref.* |
||
|
Average |
Range |
Average |
Range |
||
|
Groundwater |
|||||
|
Fulvic Acid |
0.001 |
1 |
|||
|
Humic Acid |
0.002 |
1 |
|||
|
Rivers & Streams |
|||||
|
Fulvic Acid |
0.005 |
1 |
|||
|
0.0033 |
0.0023-0.0047 |
0.035 |
0.029-0.043 |
2 |
|
|
Humic Acid |
0.007 |
1 |
|||
|
0.0081 |
0.0071-0.0089 |
0.054 |
0.049-0.059 |
2 |
|
|
Wetlands |
|||||
|
Fulvic Acid |
0.010 |
1 |
|||
|
Humic Acid |
0.014 |
1 |
|||
*References
1. Thurman, 1985
2. Reckhow, 1984
Table 9
UV Absorbance (254 nm) to DOC Regression Equations+
|
Water |
Slope |
Intercept |
r |
Reference |
|
Tjeukemeer Lake |
24.7* |
2.7 |
0.925 |
De Haan et al., 1982 |
|
Grasse River |
19.8 |
0.65 |
0.93 |
Edzwald et al., 1985 |
|
Glenmore Reservoir |
28.1 |
-0.3 |
0.71 |
Edzwald et al., 1985 |
|
24.1 |
2.2 |
0.96 |
Smart et al., 1976 |
|
|
N.C. Surface Wat. |
29.1 |
1.44 |
0.83 |
Singer et al., 1982 |
|
Norwegian Lakes |
19.1 |
2.3 |
0.93 |
Vik et al., 1985 |
+Model: DOC (mg/l) = (slope)*(UV absorbance, cm ) + intercept
* Based on absorbance at 250 nm, neutral pH.